However you look at these charts, they are not the complete picture. If the expectations of a rise in Fed funds rate is expected within the 2015/2016 horizon, capital flight from emerging markets could cripple their already fragile economies (politics aside).
In terms of North America, a recent article by the Financial Times ‘Saudi claims oil price success‘ draws from what a Saudi official told the FT, “There is no doubt about it, the price fall of the last several months has deterred investors away from expensive oil including US shale, deep offshore and heavy oils.” Thus, the Saudi strategy seems to have been simply push out high cost oil producers. On the other hand and as highlighted below, a drop in oil prices has resulted from high production (high supply) and slowing consumption in emerging markets (low demand).
According to a Ziff Energy 2011 White Paper, “How Changing Gas Supply Costs Leads to Surging Production“, in theory, “[if gas prices are] assumed to increase so that the average producer is able to recover full-cycle costs, including cost of capital. Those producers [who] do not recover their full cycle costs will reduce drilling or exit high cost basins and plays, decreasing gas supply. [On the other hand,] Higher prices translate to greater cash flow and increased development.” Sounds simple right? It is as long as the assumption are followed in reality, which they are not. While the 2011 paper further delves into its ‘predictive gas production model’, its gas price impact model showed an interesting prediction:

However, I still do not believe that this is the full truth. I’m unsure whether Saudi Arabia has dominant control of OPEC, or whether it has been shared with the US, as high volume of oil extraction (in barrels) has remained among the dominant producers. After the onset of the financial crisis, production of US shale gas (depicted below) rose to 2.02 trillion cubic feet, a 71% YoY from 2007 to 2008.

The S&P 500 between 2007 and present: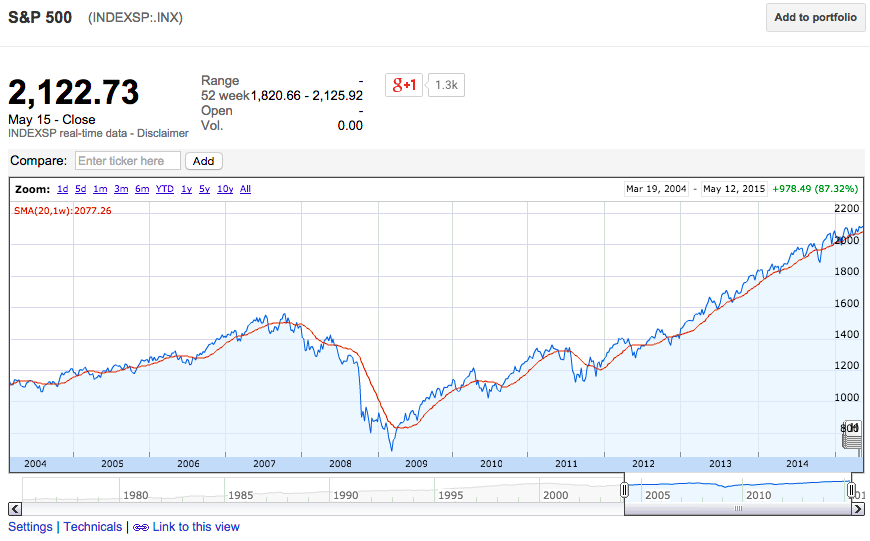
Now, in light of the above graph of US production, compare this to the drop and rise of the S&P 500 between 2007 and present. The below two tables shows the monthly oil data survey (excel from iea.org) from the International Energy Agency, since 2013. It indicates that total refinery intake has dropped, consumption has stagnated in 2014, from 2013.


What I do find slightly suspect is the lack of outcry by prominent NGOs across the world, i.e. Greenpeace International, WWF, etc. These NGOs, at first glance and in the eyes of the media, seem to be concerned with what’s going on now, not tomorrow. Furthermore, they seem stuck on unique and systemically insignificant issues, e.g. check out Greenpeace’s ‘Our Ships‘. You would think that an organization with annual expenditures of €293m in 2013 (2013 annual report, page 39) that the organization would be influencing policy think tanks and special interest groups in steering oil production towards a more ‘sustainable’ future.
So: Yes, although disputed by many, there is global warming. Yes, industrialized nations are producing emissions and causing pollution levels to rise. Yes, we are squandering away all our ‘natural’ resources. But no, we are not doing anything constructive about it, yet.
