Below is a summary from Bloomberg Brief’s Economics Asia on Thursday (pdf) and Friday (pdf), along with material drawn from Thomson Reuter’s The Day Ahead (pdf).
In Thursday’s Big Picture, Fielding Chen says that the Fed have put a first interest rate hike on the agenda within 2015. However, the consequences on Asian markets could be grave as such a move would help strengthen the already strong US dollar as the Fed stopped QE late last year, while the ECB and Japan are moving in the opposite direction.
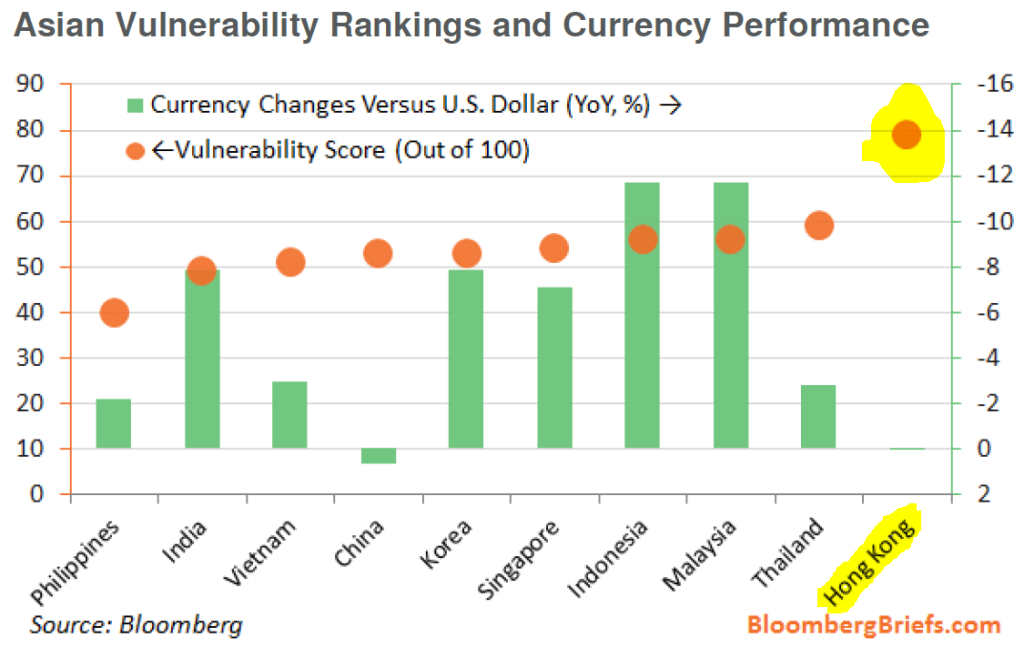
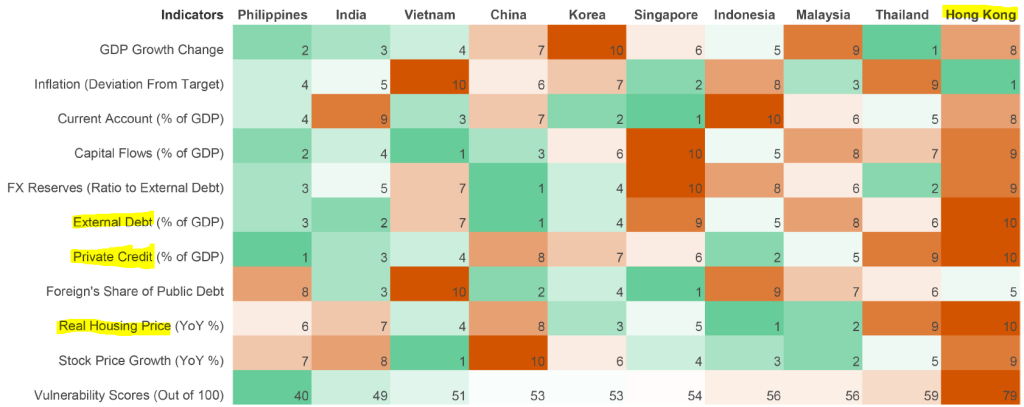
The above tables compiled by Bloomberg indicate that Hong Kong stands as the most ‘vulnerable’ nation to a hike in the US interest rates. As Chen states, “The economy is heavily leveraged, with domestic credit reaching about 220% of GDP as of the end of 2013. This has fueled rapid rises in equities and housing prices. External debt amount to 446% of GDP as of end-2014. The city ranked low in eight of our ten metrics, with its weaknesses both domestic and external. Hong Kong’s distinct profile as a mature economy with a large financial sector would account for some of its rankings.” Just north of the border, Chen states that, “It’s worth noting that China, the region’s largest economy and main growth engine, may not be as vulnerable as some expect. High foreign reserves, low external debt and low foreign-held public debt all buffer the economy from external shocks. Still, slowing growth, heavy leverage and potential asset bubbles mean the economy has its fair share of home-grown problems.”
Chen reassures us that, “The results of our assessment appear to have been partially priced in by the markets. Currencies of Asian countries have fallen across the board against the U.S. dollar in the past year, with China being the only exception.” He further states that, “This data also allows a comparison of vulnerabilities today versus the “taper tantrum” of the second half of 2013. Compared with that period, Asian nations generally are growing more slowly and have greater financial stress. Still, lower inflation provides more room for policy easing to buffer the region from external shocks, while strong current accounts in most countries [which Hong Kong does not have] would help them to weather the Fed’s rate normalizatoin cycle.”
As for market indicators:
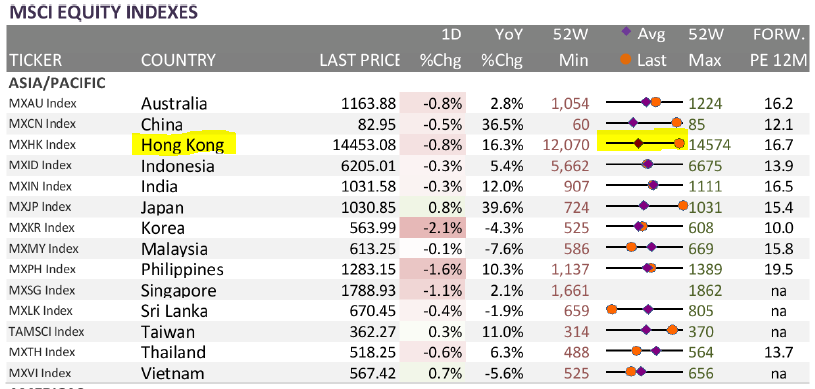
The Hong Kong equity market is at the top of its 52-week period, as highlighted upon in part 1 of 2. Additionally, China, Hong Kong, and Japan equity markets are at the height of their 52-week period, further making the more advanced emerging markets vulnerable to a US interest rate hike.
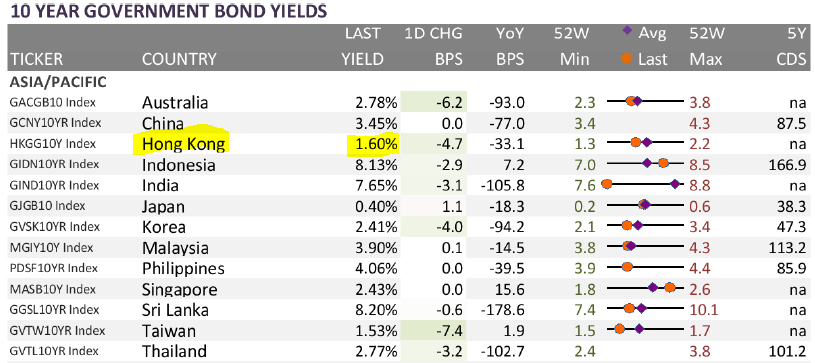
Although it could be a result of the ease of portfolio diversification in Hong Kong (I am unsure), but the yield on 10-year government bonds are one of the lowest among the Asia/Pacific group. As bond yields have an inverse relationship to their price, at 1.60%, Hong Kong 10-year bonds are the 3rd lowest yielding 10-year behind Taiwan at 1.53%, with Japan’s 10-year bond yields historically low leading the region.
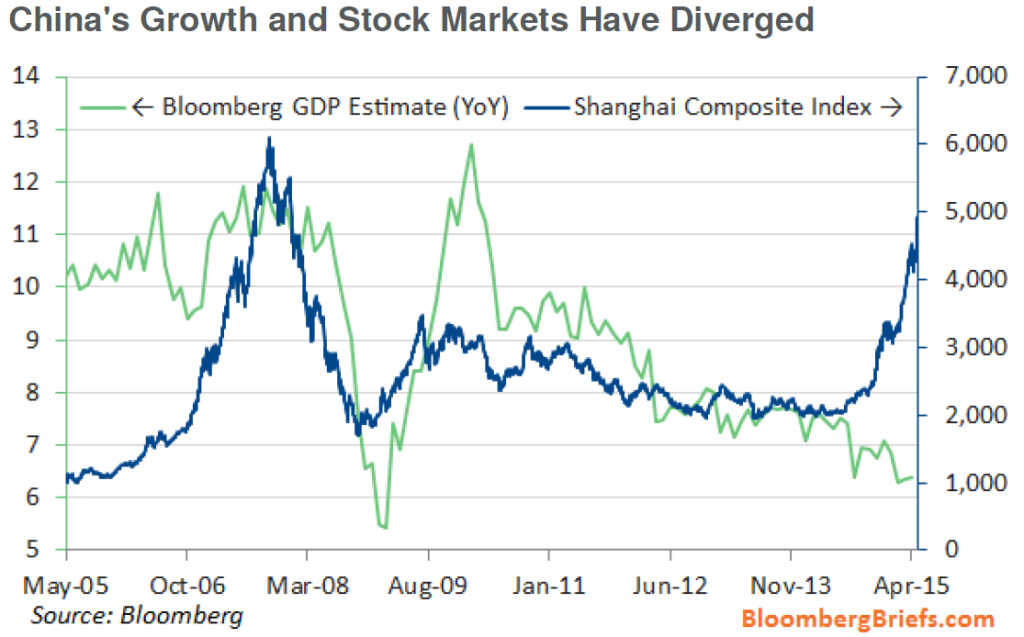
As mentioned in part 1 of 2, Chinese share prices have gradually but consistently risen over the previous 12-15 months and recently helped push up the equity market in Hong Kong as a result of the funds flowing into Hong Kong from the Shanghai connect. However, as Tom Orlik indicates in Friday’s Economics Asia, “The wild rally in China’s equity markets may be coming to an end. The Shanghai Composite Index fell 6.5% Thursday as margin calls from brokers and a liquidity drain from the central bank spooked investors.”
Orlik suggests that the recent slowdown in Chinese economic activity has been partially offset by the boom in its equity markets. So he poses the question, “What would a stock slump mean?” So far, the slump has been prevented by three channels:
1. Increased broker fees have increased the financial sector’s contribution to the national GDP data, ‘or so they say.’ Orlik states that contributions from the financial sector were the only “bright spot in the first-quarter GDP data,” partially offsetting the drag from real estate and heavy industry.
2. Higher equity valuations have made it more attractive for firms to raise funds in the debt and equity markets, as highlighted in part 1. While IPOs have been restarted as of 2014, it amounts to 4% of total social finance, a quarter of the 2008 figures when it was 17%.
3. A positive wealth effect (increased consumption through increased perceived wealth) has increased domestic consumption, thereby raising company profits. In theory, higher equity prices mean a greater value of wealth, thereby stimulating consumption. While Orlik is skeptical of whether the wealth effect is strong or weak, the 125% rise in stock market valuations is significant, even if the wealth effect is weak.
Orlik proposes a further channel of the wealth effect which is the increased wealth of Chinese corporations who are investors in equities, “holding each other’s shares and parking spare cash in the markets.” The National Bureau of Statistics showed that gains from investments accounted for the bulk of the increase in profits.
Orlik concludes that “Thursday’s market correction underlines the inherent risks in a momentum-driven rally. With valuations further away from fundamentals, margin trades accounting for a significant share of the action and novice retail investors playing a major role, the risk of a substantial reversal is high.“
