Risk-free rates: can they get much lower?

This week’s topic:

  1. US government bond yields, can they get much lower?

Equity Indices
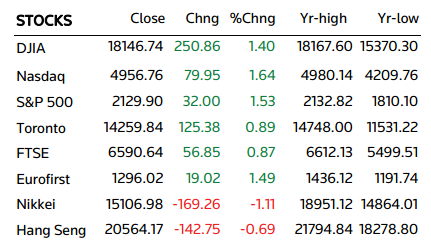
Markets ended July 8, 2016

Markets in the East (Australia, China, Hong Kong, Japan) closed lower this week, while markets in the West (London, Toronto, New York) closed much the week stronger.

  • New York’s S&P 500 gained 1.28% this week, closing at 2,129.90, a gain on the back of larger than expected NFPs on Friday, closing the index into positive territory having dropped sharply on Monday – Thursday.
  • Toronto’s TSX gained 1.39% this week, closing at 14,259.84, a gain mostly achieved by Monday’s close but with the index trailing lower until Thurday, the index didn’t recover until the US NFPs were announced on on Friday.
  • London’s FTSE 100 gained 0.19% to close at 6,590.64, a gain which recovered early week losses as the Sterling was being hampered in FX markets. The FTSE 100 has recovered 11.26% since June 14th close but has arguably not touched lows reached earlier this year in February at 5,536.97.
  • Hong Kong’s Hang Seng index contracted -1.11% this week to close at 20,564.17, an index level sitting mid-point between 2H2015 and 1H2016. The index could see moves lower as uncertainty over Brexit’s impact on China and Hong Kong are yet to be evaluated.
  • Tokyo’s Nikkei index contracted -3.67% this week, closing at 15,106.98, a week’s change becoming more common to the Japanese equity market as the previous three Friday closes were +4.89%, -4.15%, -6.03% movements.

Headline Risk-free Rates

  • US 10-year yields continued their drop this week, closing at 1.359%
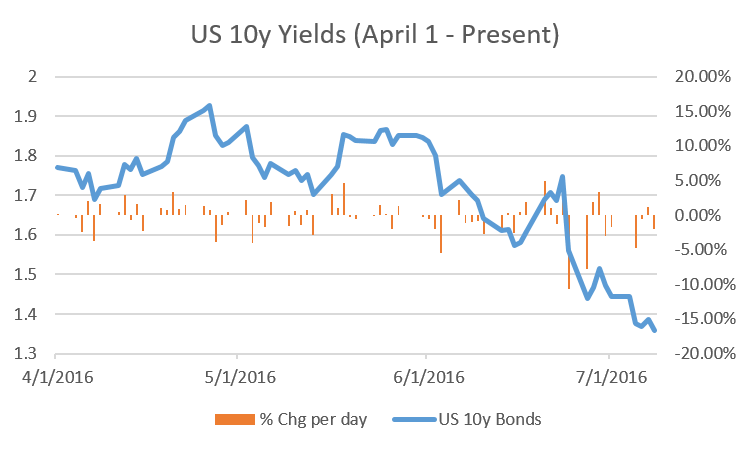
US 10-year.png

  • Canadian 10-year yields dropped back below 1% this week, closing at 0.959%
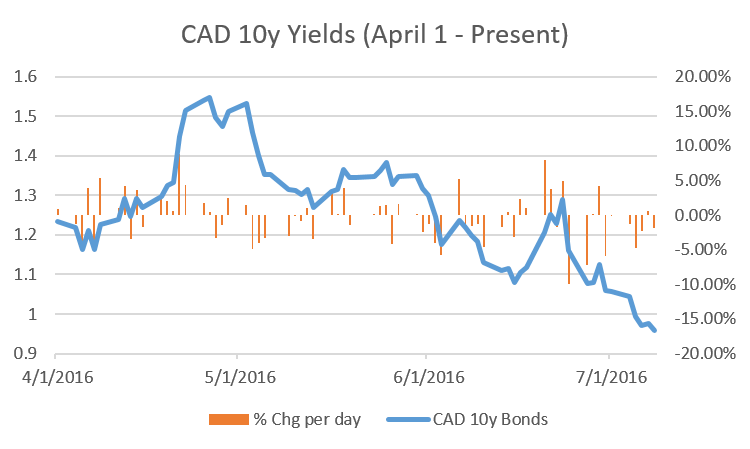
CAD 10-year.png

  • UK 10-year yields dropped sharply this week to 0.734%
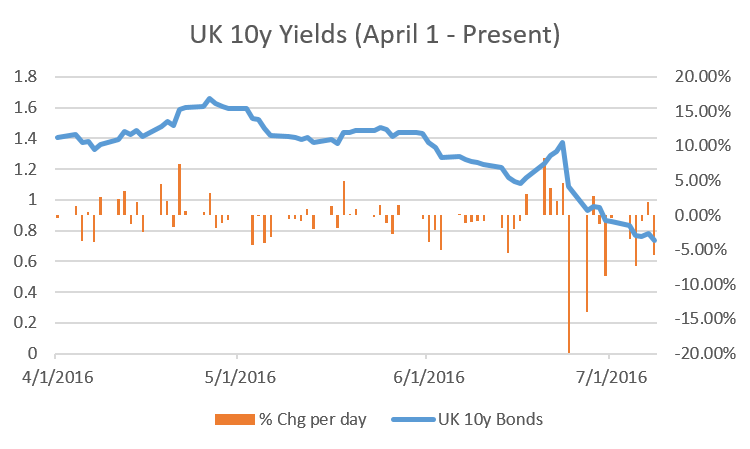
UK 10-year

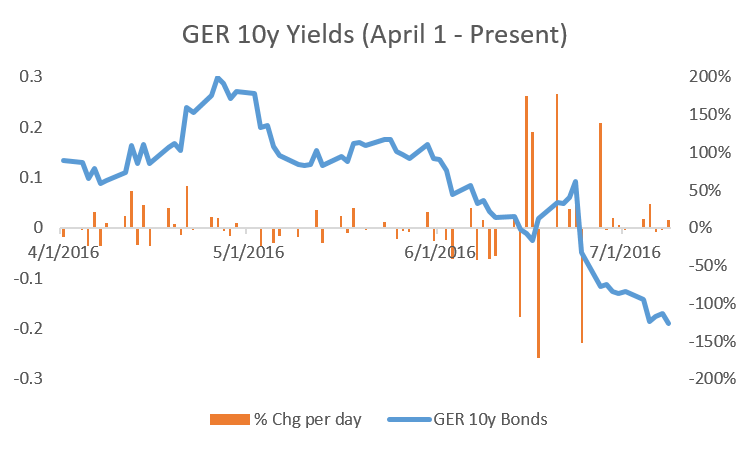
  • German 10-year yields continued their slide in negative territory to -0.189%
GER 10-year.png

10-year bond yields – Americas

CANADA 0.956
UNITED STATES 1.363
CHILE 2.274
PERU 2.445
MEXICO 2.846
COLOMBIA 3.304
CHILE 4.361
BRAZIL 4.743
PERU 5.700
MEXICO 5.810
COLOMBIA 7.516
BRAZIL 12.011
VENEZUELA 26.215

10-year bond yields – Europe

SWITZERLAND -0.694
GERMANY -0.190
LUXEMBOURG -0.047
DENMARK -0.010
NETHERLANDS -0.002
FINLAND 0.068
AUSTRIA 0.086
FRANCE 0.101
SWEDEN 0.126
BELGIUM 0.146
CZECH 0.315
SLOVAKIA 0.412
IRELAND 0.418
BRITAIN 0.732
NORWAY 0.848
SLOVENIA 0.938
SPAIN 1.142
ITALY 1.190
ISRAEL 1.590
BULGARIA 1.960
HUNGARY 2.810
POLAND 2.864
PORTUGAL 3.047
ROMANIA 3.150
CYPRUS 3.660
CROATIA 3.739
TURKEY 3.886
ICELAND 5.989
LEBANON 6.888
GREECE 7.757
UKRAINE 8.129
RUSSIA 8.370
SOUTH AFRICA 8.691
TURKEY 8.950

10-year bond yields – Asia-Pacific

JAPAN -0.283
TAIWAN 0.661
HONG KONG 0.829
SOUTH KOREA 1.369
SINGAPORE 1.634
THAILAND 1.848
AUSTRALIA 1.879
PHILIPPINES 2.169
NEW ZEALAND 2.233
CHINA 2.808
PHILIPPINES 3.210
INDONESIA 3.256
MALAYSIA 3.632
INDONESIA 7.080
INDIA 7.385
PAKISTAN 7.794

Risk-Free Rates: Can they get much lower?

A record decline in US government bond yields, or risk-free rates, has followed a negative trend – similar Germany and Japan – as we face an ever-flattening yield curve. Thus, three things need to be highlighted regarding this movement, as Mohamed El-Erain points out:

Firstly, falling yields and a flattening yield curve (traditionally) would indicate investor expectation of an upcoming recession, yet in reality the data points in the opposite for the US economy.

Institutional holdings of US government bonds have looked to capture the ECB and BoJ stimulus measures as regional economic uncertainty mounts. Brexit adds fuel to the fire as uncertainty builds in already fragile markets, straining Europe-wide economic policy as they face stronger pressure from anti-establishment movements.

This is negative for two reasons: German Bund yields have closed in negative territory for the [second week], which in turn make US government bonds more attractive as US 10-year yields remain above 1.3XX% vs. -0.1XX% for German 10-year bunds.

So long as demand strengthen for US 10y bonds, yield will continue to drop and distort our understanding of risk-free rates.

Secondly, our understanding of risk-free rates has allowed us to build a model for equity valuations, primarily through WACC. However, dysfunctional advanced economies’ risk-free rates could have serious consequences on the stability of future equity values.

A worsened outlook on financial institution profitability complicates the situation as banks function as credit intermediaries, a cog imperative to our credit cycle. If economic growth continues to slow, banks will face increasing pressure to lend as the quality of their loan portfolios deteriorate further.

Lastly, the Federal Reserve, particularly the FOMC, has become the focus of investment attention as the pace at which the Funds Rate ‘normalizes’ is seen as an investment proxy to economic health, particularly that of the States.

The Federal Reserve controls the Federal Funds Rate, an interest rate used in the overnight lending market (Primer on Federal Reserve). Traditionally, the FOMC would change the Funds Rate and indicate its forecast for inflation and economic growth; however, the FOMC enacted a large-scale asset repurchase (Quantitative Easing) program in which it’s SOMA and Fed NY Desk stands to buy and sell securities (primarily bonds) in the market. This false demand affects the underlying interest rate.

The FOMC is being increasingly burdened by uncertainty, from the slowdown in Chinese economic growth to the UK’s referendum, and as the FOMC maintains a Funds Rate will increase over time stance, capital flight will be the primary concern for institutional investors.

So what is the implication?

Asset price inflation.

Low/negative government policy rates have led to lower/negative government bond yields as investors price a low-to-negative real growth (nominal – inflation) in the short-term with long-term government bonds continuing to yield positive, albeit in the decimal places.

The Danish Krone, Swiss Franc, Japanese Yen, and Euro policy rates are all in negative interest rate territory.

Low interest rates meant to stimulate borrowing is to be used for investment purposes. This maintains a Keynesian view of the economy in that aggregate demand (total spending) will generate greater output, i.e. GDP; however, the reality has been quite different.

Lower interest rates have led to higher equity valuations as companies borrow money to pay dividends, stock buybacks, or simply hold cash & equivalents. Higher equity valuations result in higher equity risk premiums, as the spread between expected return on equity and expected cost of capital widens. Furthermore, as low to negative interest rates signify low to negative real economic growth, the current risk free rate should be used a cap on the perpetuity growth method and thus reflect a lower present value.
Has freight shipping become too big to fail?

Main topic of this week:

  • Airlines and shipping containers, can they get any bigger?

Equity Indices

Equity markets recovered from last week’s Thursday & Friday asset-wide losses post-Brexit decision as exchanges executed bets & hedges made prior.

  • UK’s FTSE 100 index led the charge as it recovered 7.15% to close at 6,578, the highest close since August last year. This could be a result of increased investment demand as the Pound reaches a near 30-year low;
  • US S&P 500 gained 3.22% to close at 2,103 or 93% above 52w lows, a position which will test FOMC policy makers on whether to continue with its coming two Funds Rate hikes;
  • Japan’s  Nikkei 225 gained 4.89% to close at 15,682.5; however, the Nikkei 225 index remains in a YTD low territory as it started the year at nearly 19,000 and dropped 8% last Friday (16,238 => 14,952) post-Brexit;
  • Hong Kong’s Hang Seng index closed 2.64% higher this week at 20,794 (on Thursday as markets were closed on July 1st), a position around 10% lower than a 22,000 index close analysts are forecasting; and
  • China’s CSI 300 closed 2.50% higher at 3,154 as the CSI 300 index looks to continue recovery from its Dec-15 to Jan-16 sell-off.

Government Bond Yields

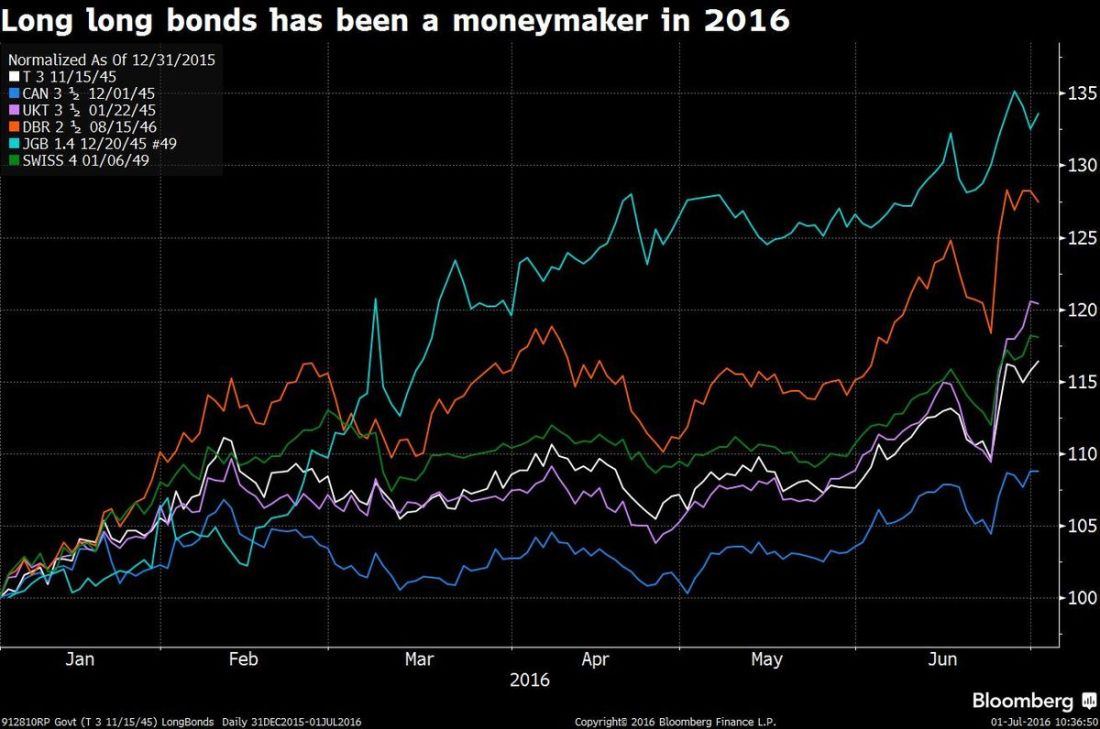
Government bond yields continue their path into new horizons as outdated pension fund mandates drive bond yields stronger into negative territory with the help from ECB and BoJ large-scale asset repurchase programme.

In fact, the capital return on government bonds YTD have been the best performing asset class as 30-year government bonds have generated double-digit gains:

Bloomberg article 2016.07.03.jpg

  • US 10-year yields closed at 1.44%, down 8% this week from 1.56% last Friday;
  • CAD 10-year yields closed  1.05%, down 10% this week from 1.16% last Friday;
  • UK 10-year yields closed at 0.86%, down 21% this week from 1.08% last Friday;
  • GER 10-year yields closed at -0.13%, down 165% this week from -0.05% last Friday; and
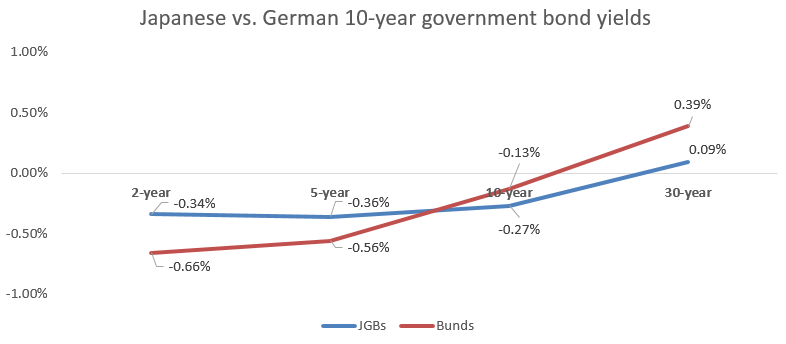
  • JPY 10-year yields closed at -0.27%, with a yield curve compared to GER 10-year bunds looking like this:

Capture.PNG

From the above graph, Germany 2- & 5-year government bond yields are suppressed further than the equivalent Japan government bond yields, while Japanese 10- & 30-year government bond yields are flatter than Germany’s – a function most likely the result of Japan’s banking framework previously covered here and here

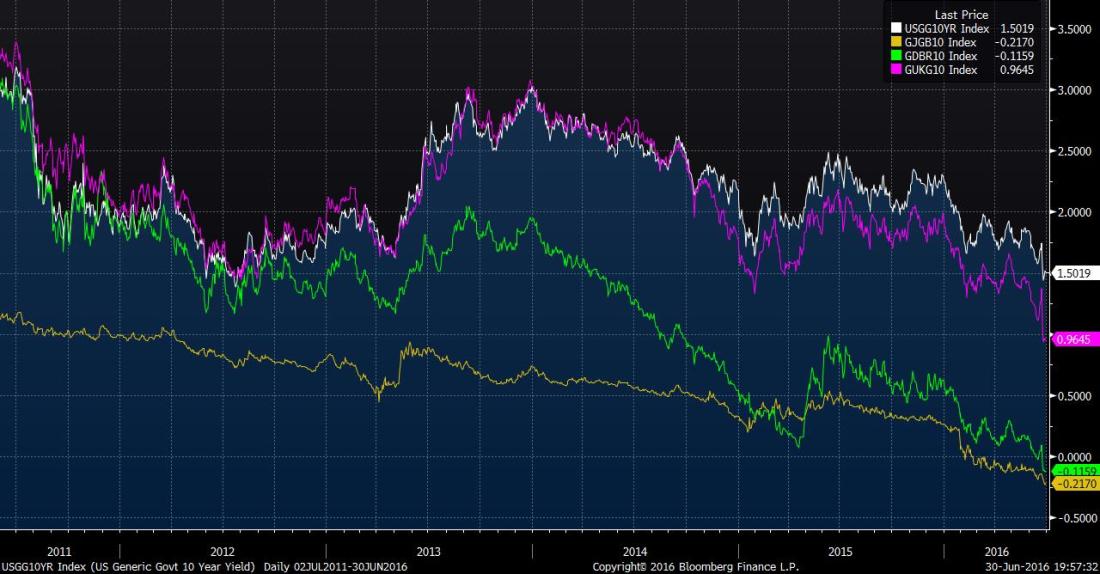
And as previously highlighted, risk-free rates have come are becoming riskier as they push towards a long-term trend in negative territory:

USGG10YR Index (US Generic Govt 2016-06-30 19-57-30.jpg

The above graph depicts the 5-year decline in risk-free rates of the US (white line), UK (purple line), Germany (green line), and Japan (yellow line).

Currency Moves

Free-floating currencies were much less volatile this week as institutional and stay-at-home FX traders continue to chart what the latter half of 2016 will have in store regarding interest rate decisions and economic forecasts.

The following currencies quoted against the US dollar:

  • Chinese Yuan: 6.6422
  • Japanese Yen: 102.52
  • Canadian dollar: 1.2915
  • Australian dollar: 0.7491
  • British Pound: 1.3272
  • Euro: 1.1139

Is Bigger Better?

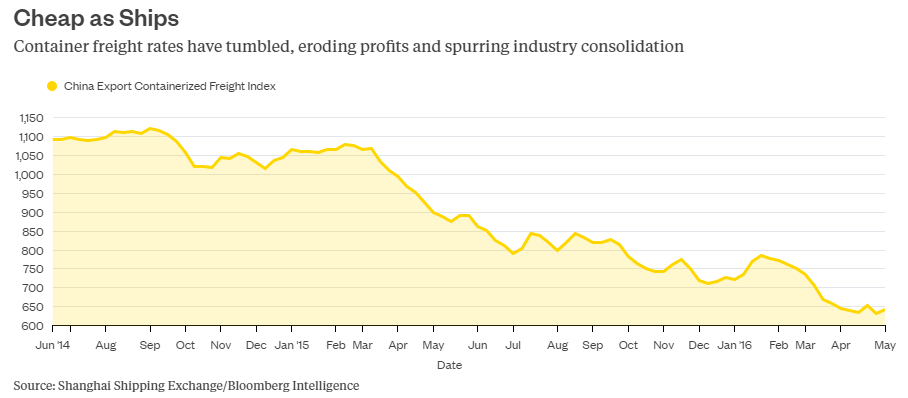
The shipping industry has doubled in size several times since 1955 as a result of globalization and financial interconnectedness. In fact, healthy shipping volumes have spurred ship manufacturers to double capacity every 20 years in the last half century, a trend which has evaded the radar of climate change agreements.

Bigger_Better_1

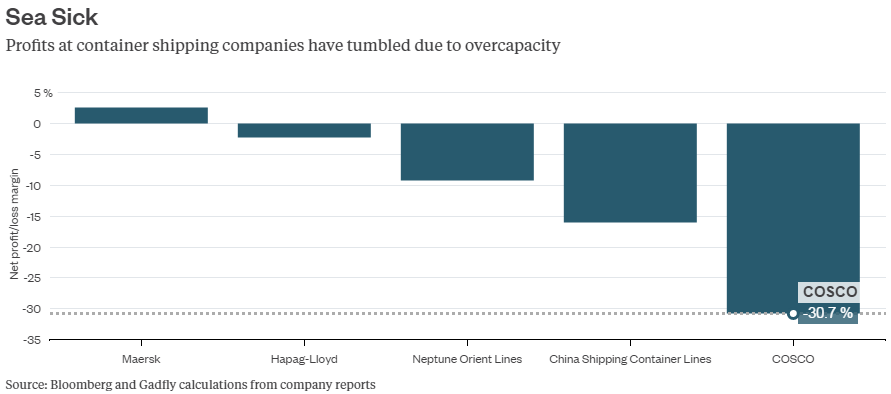
During healthy economic growth and demand, large ships translated to economies of scale and thus more competitive freight prices, which in turn spurred greater export/import trade. However, growth in the shipping industry appears to have slowed down post-financial crisis as global trade volumes squeeze. This leads to a negative effect on cargo revenues:

Bigger_Better_2

Slowing growth in global trade volumes should see the growth in shipping capacity similarly curtail, but the opposite has occurred. Despite a curtail in shipping volumes, the number of orders for larger ships has continued to grow as industry experts insist volume and capacity will trump, seizing the economies of scale.

The most obvious argument against the need for ever-larger ships still holds: destination ports, and whether these can modify their facilities to accommodate the arrival of ever-larger ships. These ports require new infrastructure, such as new cranes, taller bridges, environmentally perilous dredging, reconfiguration of container yards – costly disruptions when global import demand curtails.

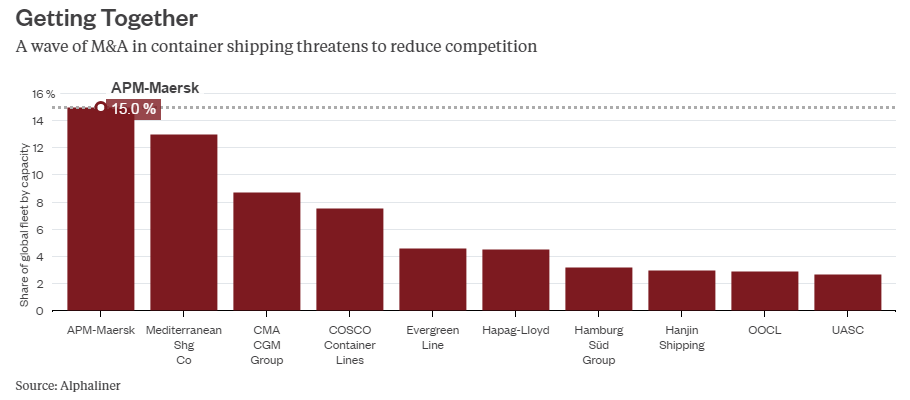
While vessel-sharing partnerships (similar to airline code-sharing arrangements) aren’t original, consolidation of the shipping industry has resulted from cost cutting measures, by boosting ship capacity synergies, and economies of scale; however, this could have a negative impact on the industry’s prospective growth: consolidation leads to a lack of competition.

Bigger_Better_4

It appears that, at least in the long-term, (relatively) smaller and more fuel-efficient ships will pave the new path forward as large ships become targets of pirates and terrorists looking to exploit a ransom against the value of cargo aboard.

The pace at which shipping capacity outstrips demand is worrying – shipping capacity is expected to increase by 4.5% in 2016 and 5.6% in 2017, whilst global demand is expected to grow by just 1%. In fact, the newest and biggest shipping containers now carry ca. 18,000 twenty-foot-equivalent units with plans to expand capacity to 22,000-TEU by 2018, then 24,000-TEU soon thereafter.

The idea is that shipping costs can be lowered so long as these new ever-larger TEU ships are operating with full capacity. While engineering has yet the opportunity to test larger, longer ship sizes, structural risks springing and whipping are concerns, perhaps less material than a concern over capacity.

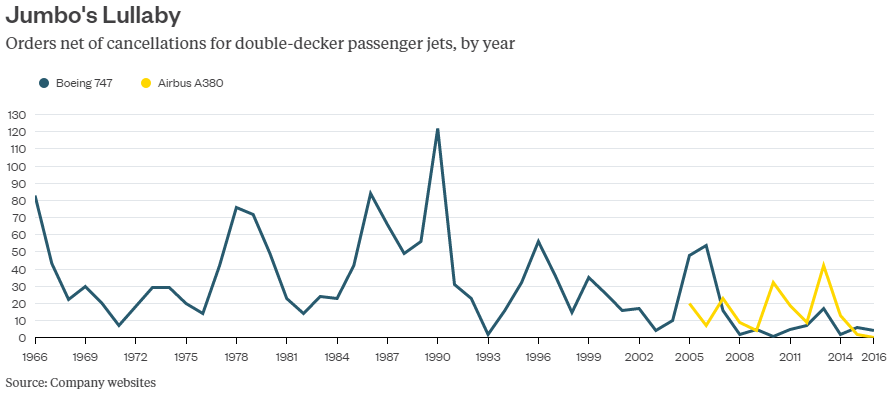
The airline industry stands as an interesting comparison to the shipping problem as both industries forecast a positive growth in capacity while curtailing demand are dangerous to tight margins. Both the airline and shipping industry are mature markets with developed infrastructure – the number of new orders for planes and ships gives a good indication on sentiment of future growth:

Bigger_Better_5

It has become clear that “the future of aviation lies in smaller, quitter and more fuel-efficient planes that can carry fewer passengers at greater frequencies between more destinations,” according to Bloomberg Gadfly. In fact, airport pairing and frequency growth of airlines could lead towards the average size of planes going down.

It is obvious that at current oil prices, airlines have the flexibility of pondering whether to go big or go home, just not for long.

On the investment wisdom of George Soros

A broad overview of currency arbitrage and implications as a result of the UK’s referendum vote.

Position on Europe:

  1. Short: European equities, Euro, EU debtor nation bonds
  2. Long: British equities, Pound, Gold

Equity Indices

Equity indices took a hit around the globe on Friday as the UK referendum vote came in with 51.9% favouring to oust the UK from the EU. Rest assured, the short-term impact of Brexit on investment portfolios was ‘defensively’ hedged by most fund managers who promptly released statements to investors that assured them holdings were safe, at least in the near 6 months.

  • Japan’s Nikkei 225 closed -4.15% lower this week at 14,952 [setting a new 52w low];
  • Hong Kong’s Hang Seng closed 0.44% higher this week at 20,259 [sitting 23% above 52w lows];
  • China’s CSI 300 closed -1.07% lower this week at 3,077 [sitting 14% above 52w lows];
  • London’s FTSE 100 closed 1.95% higher this week at 6,139 [sitting 48% above 52w lows];
  • New York’s S&P 500 closed -1.63% lower this week at 2,037 [70% above 52w lows]; and
  • Toronto’s TSX closed -0.07% lower this week at 13,892 [sitting 69% above 52w lows].

Government Bond Yields

Government bond yields of advanced (risk-free) nations have continued to set new lows as portfolio managers continue to increase holdings of these low-yielding assets, while on the other hand we have Venezuelan 10-year bonds spike up towards a yield of 28%.

  • US 10-year yields closed at 1.560%, a drop of 3% or 49 basis points for the week;
  • CAD 10-year yields closed at 1.163%, a gain of 4% or 46 basis points for the week;
  • UK 10-year yields closed at 1.086%, a drop of 5% or 57 basis points for the week and opposite to the convention that yields should drop on volatility and expected repayment risk; and
  • GER 10-year yields closed at -0.047, a drop of 65 basis points for the week and is the first week Bund yields have closed Friday in negative territory (briefly closing at -0.025% last Thursday).

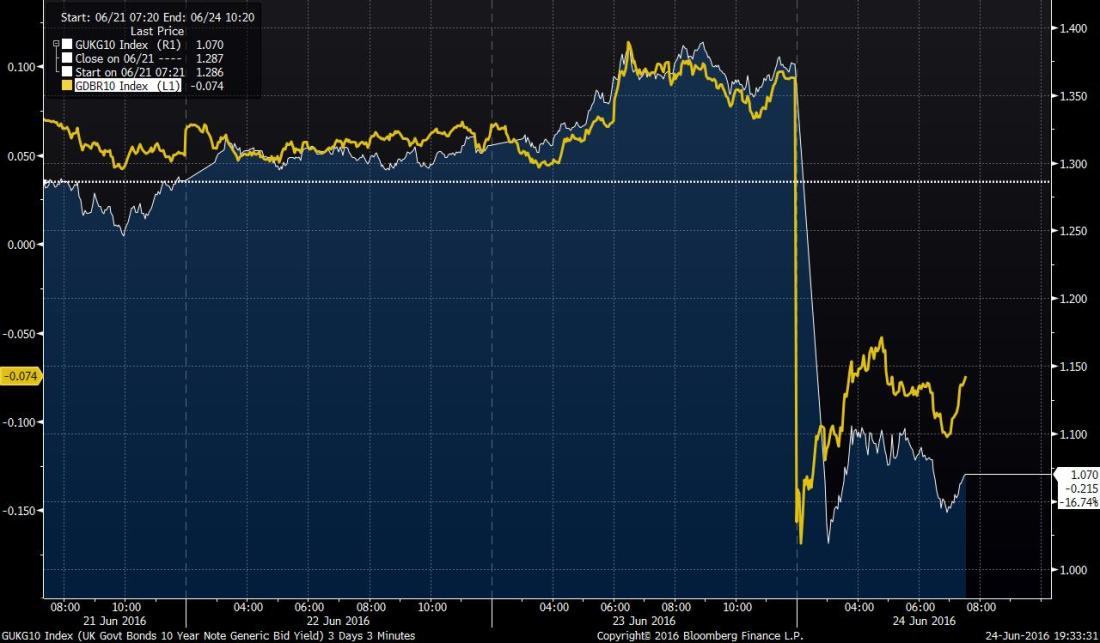
UK 10-year (White line) vs. German 10-year (Yellow line)

GUKG10 Index (UK Govt Bonds 10 Y 2016-06-24 19-33-30.jpg

From the above graph, positions were triggered on the referendum vote in the UK resulting in UK and GER 10-year yields dropping>20% before recovering due to buying pressure.

Yields plummeted on news that the UK referendum decided an exit from the EU – yields move in the opposite direction to prices, suggesting that investors expect interest rates within the EU (including UK) could face a treacherous path downwards. (Note: the price of bonds react inversely to changes in interest rates – if bond prices go up or yields go down, this indicates an expectation of lower interest rate environment).

Additionally, pension and fund managers will have purchased short positions (most likely protective puts) against their LT bond portfolio, which have been required  thanks to outdated fund mandates. This will have also contributed to the immediate drop in yield of UK and GER 10-year yields.

Currency Moves

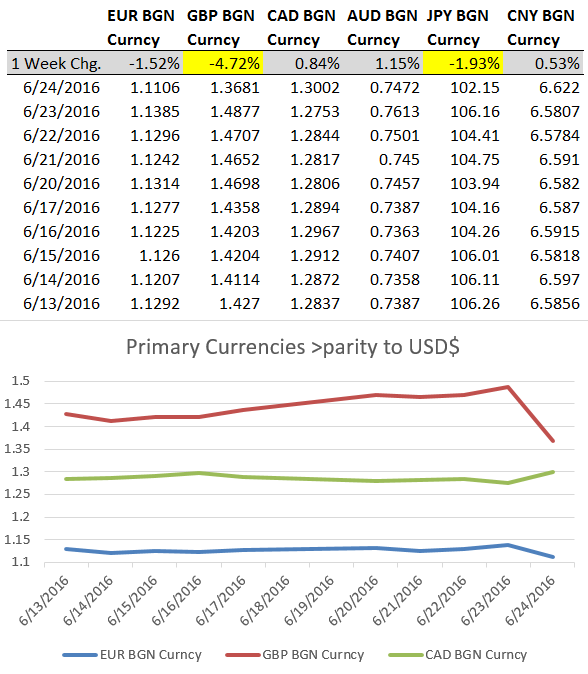
Two major currency movements noted this week: Yen and Pound.

Currency Moves week 06.24.2016

As mentioned in last week’s market brief, the Bank of Japan released guidance that they may see intervention in the Yen to prevent further economic loss due to an already export-denting currency. As the Yen lowered to 102.15/$, we are nearing the mark.

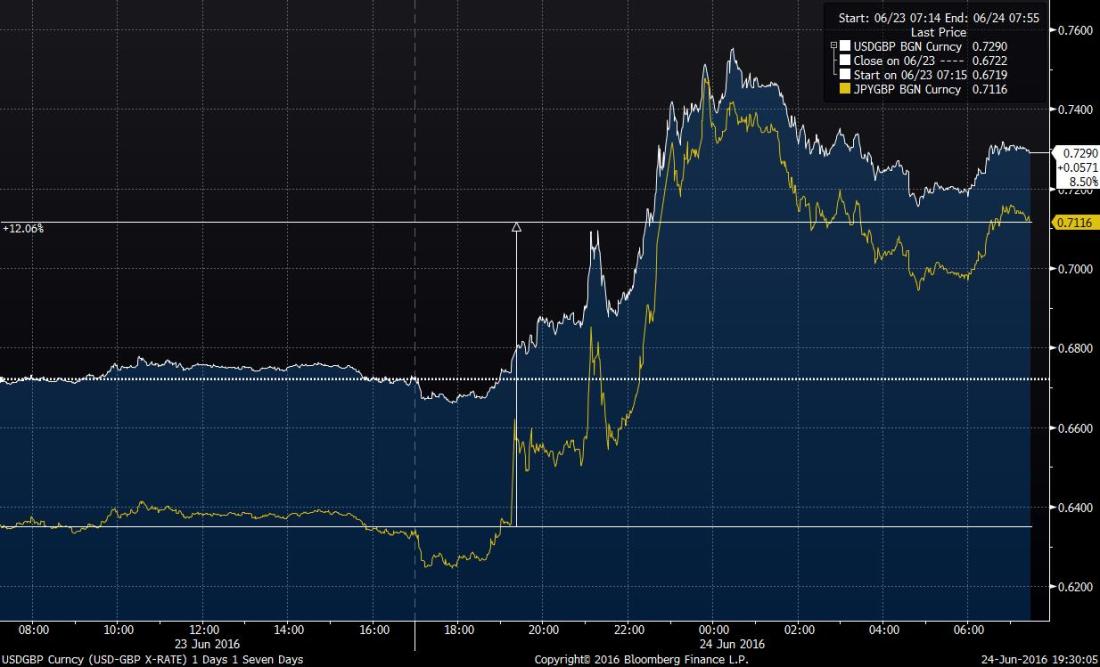
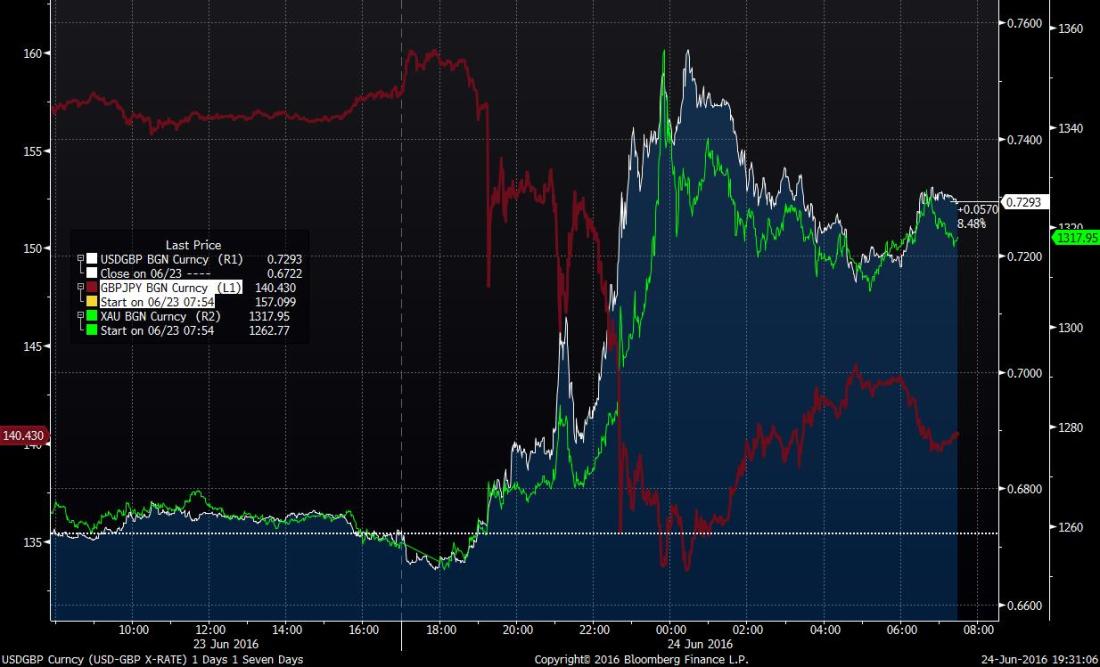
GBP/USD vs. GBP/JPY Arbitrage

USDGBP Curncy (USD-GBP X-RATE) 1 2016-06-24 19-30-02

The above graph shows arbitrage positions in GBP/JPY triggered at 19:15, followed by a steeper appreciation in the Yen vs. the Pound against the USD.

The arbitrage position between Pound and Yen was triggered immediately after the vote, as the Yen could see further depreciation against the USD in the following months.

On the other hand, we could see a strong appreciation in the Pound over the next 12 months as uncertainty over the EU sets in and the British economy will generate a much needed push as its currency is now ca. 25-30% cheaper.

Soros was long Gold, were you?

As mentioned in the market brief two weeks ago, Soros transitioned from a zero position in Barrick Gold to its largest holding within the 3 month reporting period to March 31st, 2016.

USDGBP Curncy (USD-GBP X-RATE) 1 2016-06-24 19-31-04.jpg

The above graph shows the spike in gold prices (a safe-haven asset against currency movements, especially those appreciating against the USD), with the GBP/USD spiking on referendum results and the GBP/JPY depreciating as the JPY depreciated against the USD.

Gold futures (green line) spiked following the referendum vote – an upward trend most likely will continue given uncertainty over the EU:

  1. HSBC, Standard Chartered, Barclays are the three main banks headquartered in London with global operations – how will their balance sheets hold up?
  2. Netherlands and other EU nations are discussing EU exit, how will this affect outlook on commerical loan issuance and payback? Analysis of loan portfolio duration could give good insight.
  3. If we see the EU dispand and the Euro get broken up, how will already volatile currency markets adjust and which direction will German Bund yields move?

Soros made it clear in his Guardian op-ed that Brexit would not be detrimental to the UK (believe it or not) but fuel demand by debtor nations across the EU to exit, against the interests of creditor nations: referendum vote was brought on by the UK independence party  – Italy’s Five Start Movement has just come to power in Rome, deja vu anyone?

Tian Ge Interactive: will they become a listed shell?

Main topic this week:

  • Tian Ge Interactive – will we see a spin-off into A-shares, leaving their H-shares available for a backdoor listing?

Global Indices

This week saw broad based declines in global indices:

  • Japan’s Nikkei 225 dropped -6.0% this week to 15,599.66;
  • Hong Kong’s Hang Seng dropped -4.2% this week to 20,169.98;
  • China’s CSI 300 dropped -1.7% this week to 3,110.36;
  • London’s FTSE 100 dropped -1.6% this week to 6,021.09;
  • Toronto’s TSX dropped -1.0% this week to 13,901.77; and
  • New York’s S&P 500 dropped -1.2% this week to 2,071.22.

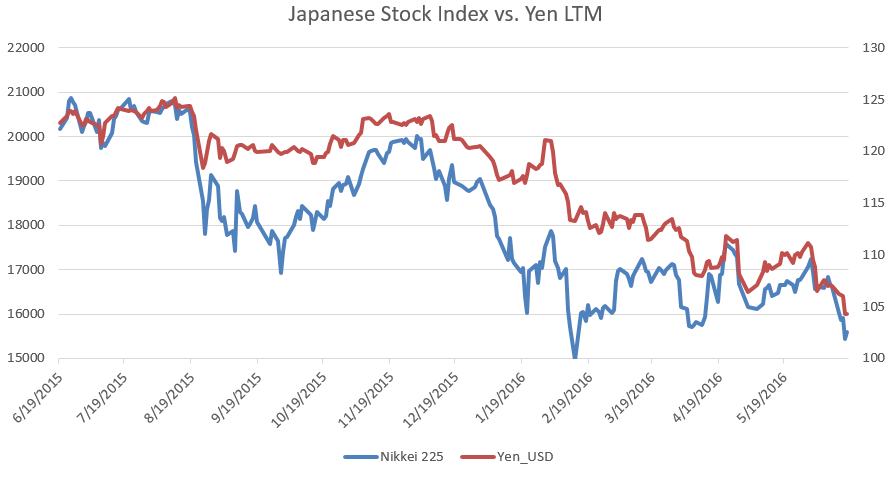
Chart 1: Japanese equities pose buy potential, esp. if Yen drops <100

Nikkei 225 vs. Yen.PNG

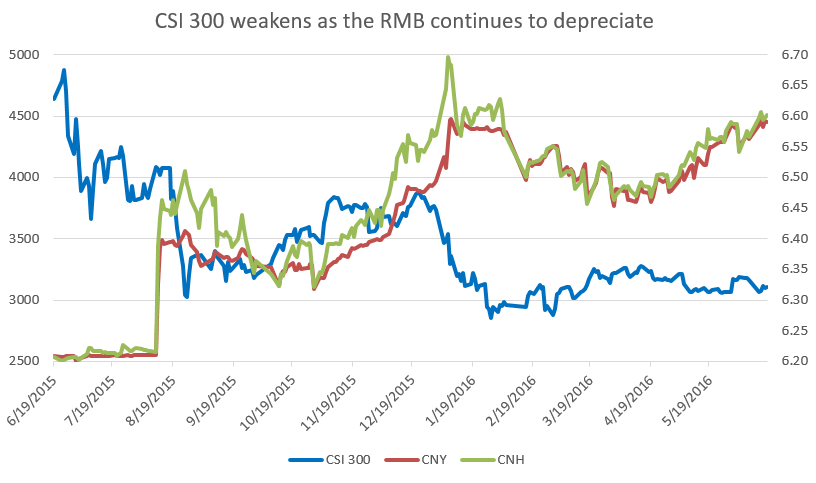
Chart 2: Chinese equities could drop further esp. if RMB depreciates

CSI 300 weakens while RMB strengthens.PNG

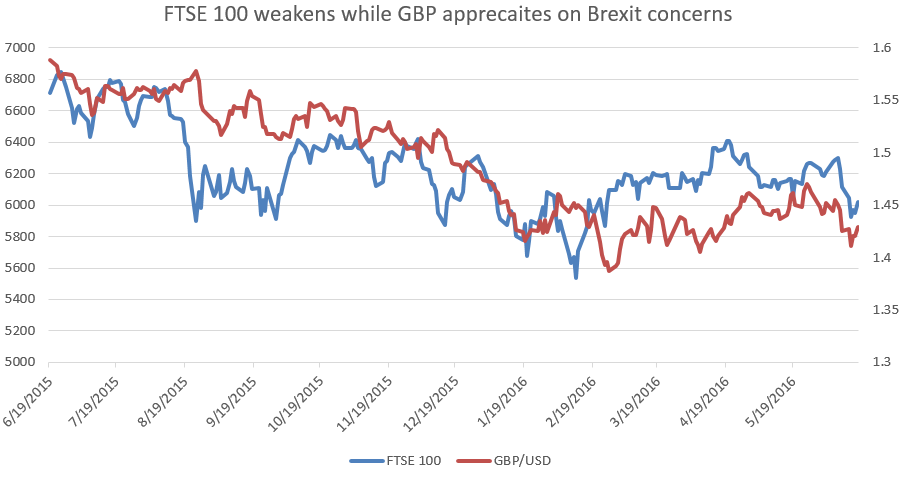
Chart 3: UK equities and Pound are cheap and show upside potential

FTSE 100 vs. GBP

Currencies

Japanese Yen depreciated following the BoJ NIRP announcement – this week’s trend lower towards 100/$ nears the level which the BoJ has issued  guidance on requiring Yen intervention to reverse the trends in an already export-dented currency situation.

British Pound trends lower as institutional capital has prepared for a ‘leave’ vote, yet we could see renewed interest in the GBP following the vote on June 23rd as the BoE could be required to intervene with monetary stimulus and lower interest rates – thus renewing demand for the Pound.

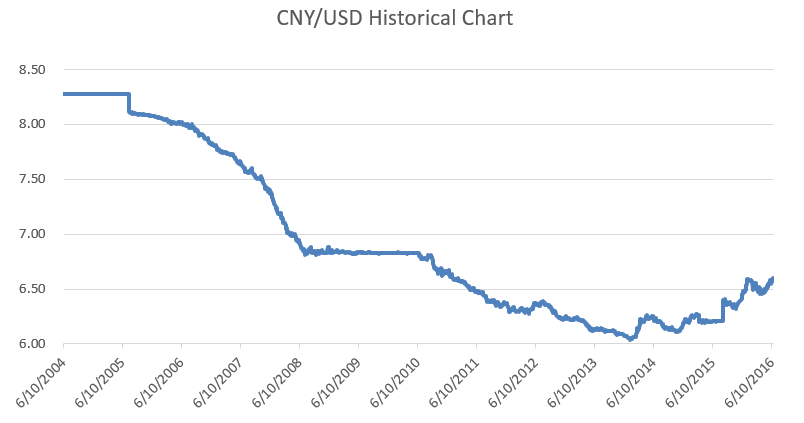
Chinese Renminbi has followed a trend of appreciation since it hit its all-time low at 6.04/$ – context is important in understand the direction of RMB appreciation:

CNY Historical.PNG

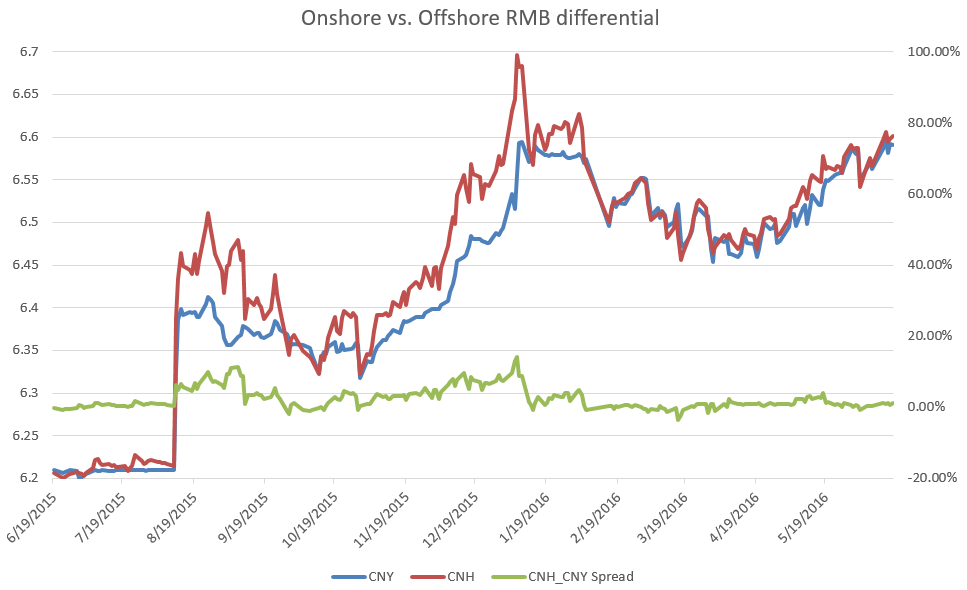
However, volatility in the RMB could persist through 2016 as the Chinese economy is bolstering for growth while geo-political uncertainty is a concern for Chinese export’s demand. Will we see another episode of RMB volatility this year?

CNH vs. CNY.PNG

Risk-free rates

German Bunds closed into negative territory on Tuesday at -4 basis points, closing on Thursday at -25 basis points, before recovering to 5 basis points by Friday.

US Treasuries closed the week 2% lower at 1.605%, closing the last year at a 29% drop ce last year.

UK 10-year yields closed slightly lower at 1.136%, dropping 8% in the week – a rather surprising feature given Brexit uncertainty.

Topic 1: Tian Ge Interactive

Introducing Tian Ge, an online live video streaming platform to 17.5 million monthly subscribers generating ca. US$90 million of revenues in 2015.

Tian Ge - Bloomberg.png

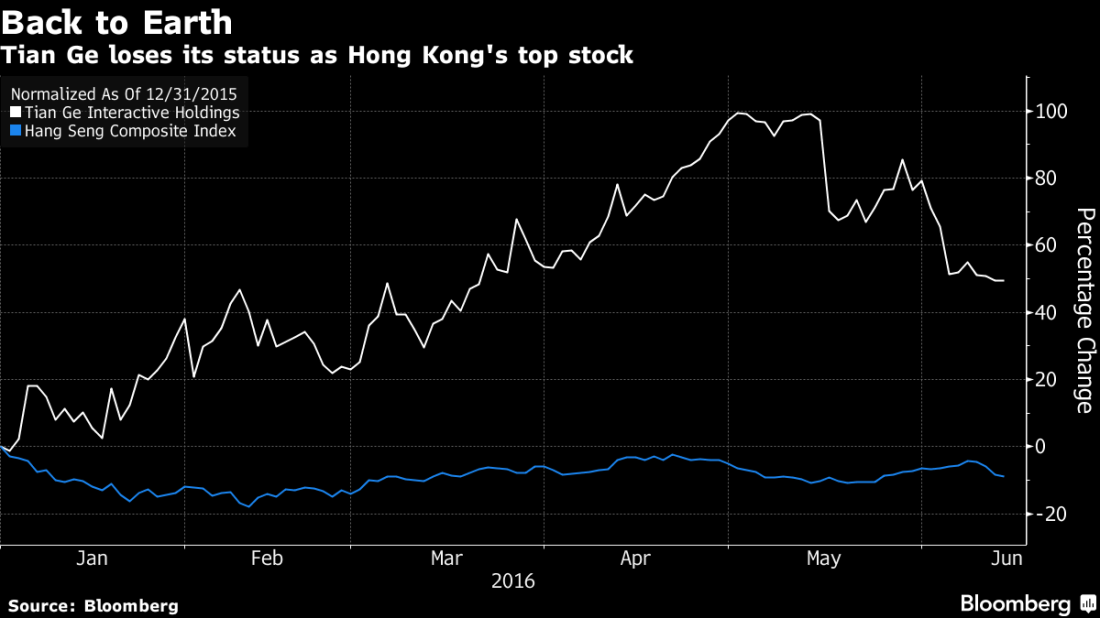
We could see Tian Ge delisting its H-shares and re-list as A-shares in China – exactly opposite to what Fu Zhengjun, Tian Ge founder and CEO, told Justina Lee of Bloomberg recently (Bloomberg article).

Since the company went public mid-2014, Tian Ge shares have gone up but then back down – a trend identical to its main business revenues and operating cash flow.

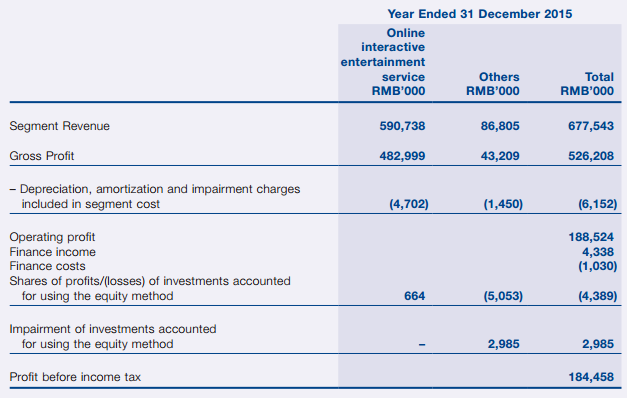
  • Tian Ge’s main business revenues dropped 30% drop from RMB692,159,000 in 2014:

Tian Ge - Profit by Segment.PNG

  • Operating cash flow dropped 40% in 2015, despite a series acquisitions:

Tian Ge - cash flow from operations.PNG

If Tian Ge were to spin-off its main asset (online entertainment) into an A-share listing, controlling interests could profit from a loftier valuation in the mainland. A previous H-share IPO would assure road show investors that while Mainland Chinese regulators clamp down on fictitious accounting records, Tian Ge has been screened by the microscopes of HKEx.

The company’s H-shares would prove valuable, especially when its main business (Online interactive entertainment service) has been stripped away and thus leaving its subsidiaries (Others), which record enough turnover to meet HKEx ongoing turnover requirements.

Earlier this year we saw Dalian Wanda look at paying out existing shareholders to pave the way for an A-share listing. The ‘China-premium’ is ‘real’, as A-share property developers trade at 29x P/E while H-share property developers trade at 6.5x P/E, according to a recent Bloomberg article.

Note: above information is from the company’s 2015 Annual Report.


A brief analysis on Barrick Gold: where is gold headed?

Topic discussed:

  1. George Soros loads up on Barrick Gold, do Soros Funds have too much skin in the game or are they calling a gold rush?

Headline Indices

  • ASX 200 closed at 5,312.59, down -0.12% this week and sitting 58% above 52w lows;
  • CSI 300 closed at 3,163.99, down -0.79% this week (markets closed Thursday and Friday) and sitting 13% above 52w lows;
  • Hang Seng closed at 21,042.64, up 0.46% this week (markets closed Thursday only) and sitting 30% above 52w lows;
  • FTSE 100 closed at 6,115.76, down -1.51% this week and sitting 44% above 52w lows;
  • TSX closed at 14,037.67, down -1.33% this week and sitting 71% above 52w lows; and
  • S&P 500 closed at 2,096.07, down -1.46% this week and sitting 89% above 52w lows.

Bonds: a short comment

Government bond yields must become the headline story ahead of the FOMC’s upcoming June Funds Rate decision, as any further (unexpected) large scale asset repurchase program central banks enact will drive government bond yields lower – can they go lower?

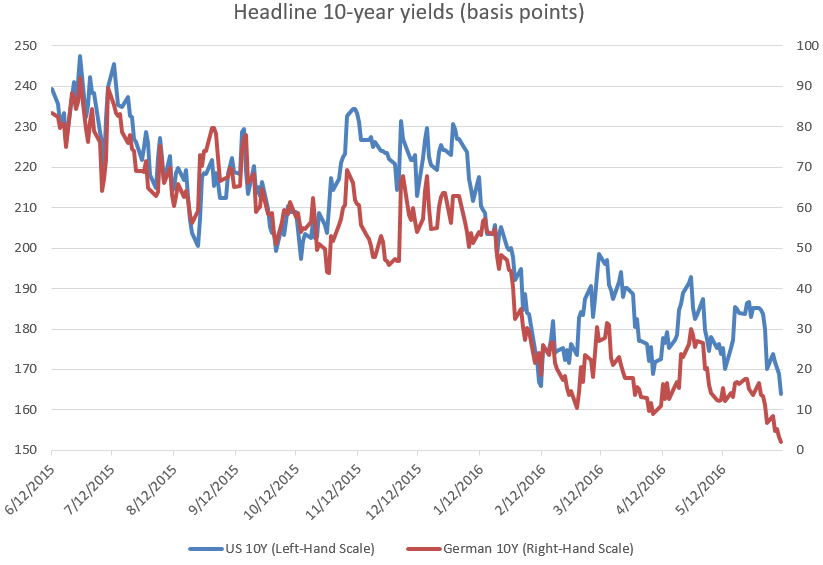
Gov Bond Yield.PNG

US 10-year yield has dropped 31% in the last year, while the German 10-year has dropped 98% in the last year.

Investors, mostly institutional, continue their uptake in government bonds – the German 10-year yield dropped 70% from 67 basis points (June 3rd) to 20 basis points (June 10th). Had we taken the yield of 113 basis points on June 2nd, Friday’s close yield would have represented an 82% drop.

Some argue that investor appetite for government bonds has now become a hunt for yield. I disagree, investor appetite still follows a traditional flight from risk and is a function of the ECB QE program – when demand (i.e. ECB QE buying) is artificially high then prices must drop to (artificially) lower level.

Alternatively, fund mandates, which require a significant allocation towards high-grade sovereign debt, could see regulation worsen the outlook on risk-free rates. We have reached the point where central banks continue to distort traditional market signals, making it more difficult for investors to interpret a fair value for bonds.

George Soros bullish on Barrick Gold

The SEC 13-F is a quarterly filing by institutional fund managers with AUM >$100m which discloses their equity and bond positions.

Soros Fund Management, in their most recent 13-F, declared that Barrick Gold became their largest holdings, effective date as of March 31, 2016. The fund had completely divested out of Barrick in mid-2015 after the share price dropped 50% to $6-7/share within two weeks.

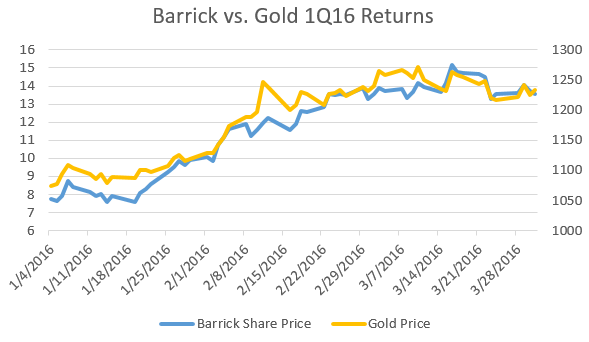
Barrick vs. Gold price.PNG

For the 61-day period between January 1st and March 31st, 2016 the Barrick share price and Gold futures price held a pearson correlation coefficient of 0.69 – suggesting strong correlation.

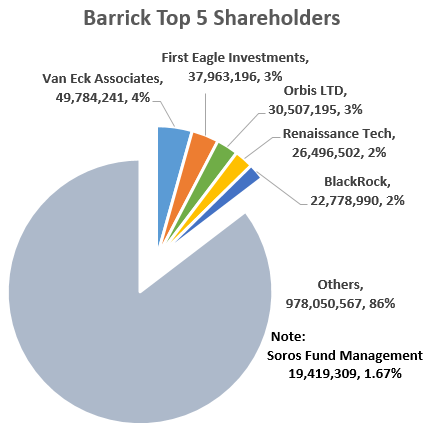
Soros Funds net position in Barrick was 19,419,309 shares, equating to 1.67% outstanding shares. This is particularly impressive since the share price has risen 75% over the 61-day reporting period, equating to a 1.23% gain per day.

Barrick Top 5 shareholders

Gold futures are the leading indicator in gold company profitability, since the company’s profitability is effectively the net of LBMA spot prices (price returned for dore gold bars) and the company’s AISC (all-in sustaining cost). Thus, the ‘funamental value’ of a gold company will depend on your outlook on gold futures – heightened geo-political risk and a stronger dollar should translate into a higher gold price.

Barrick Bonds

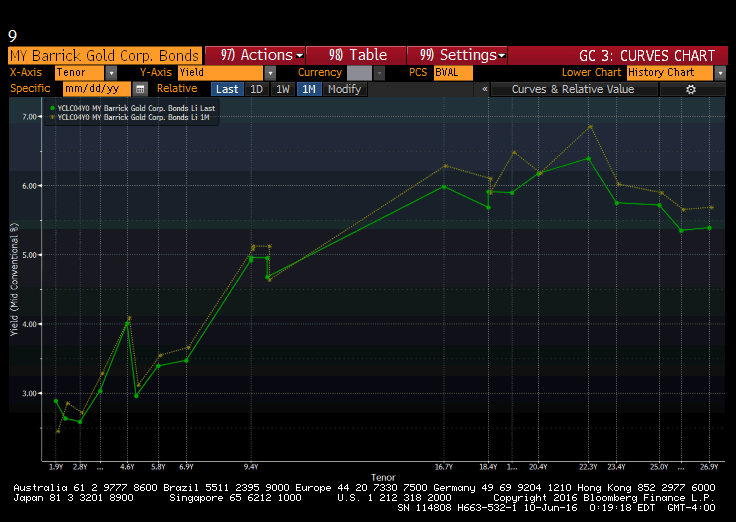
Interestingly, Soros Fund 13-F did not disclose a position in Barrick bonds, which currently have the following yield curve:

sg201606091158.gifBarrick Gold’s yield curve was self-created and is not a standard function as part of Bloomberg Terminal.
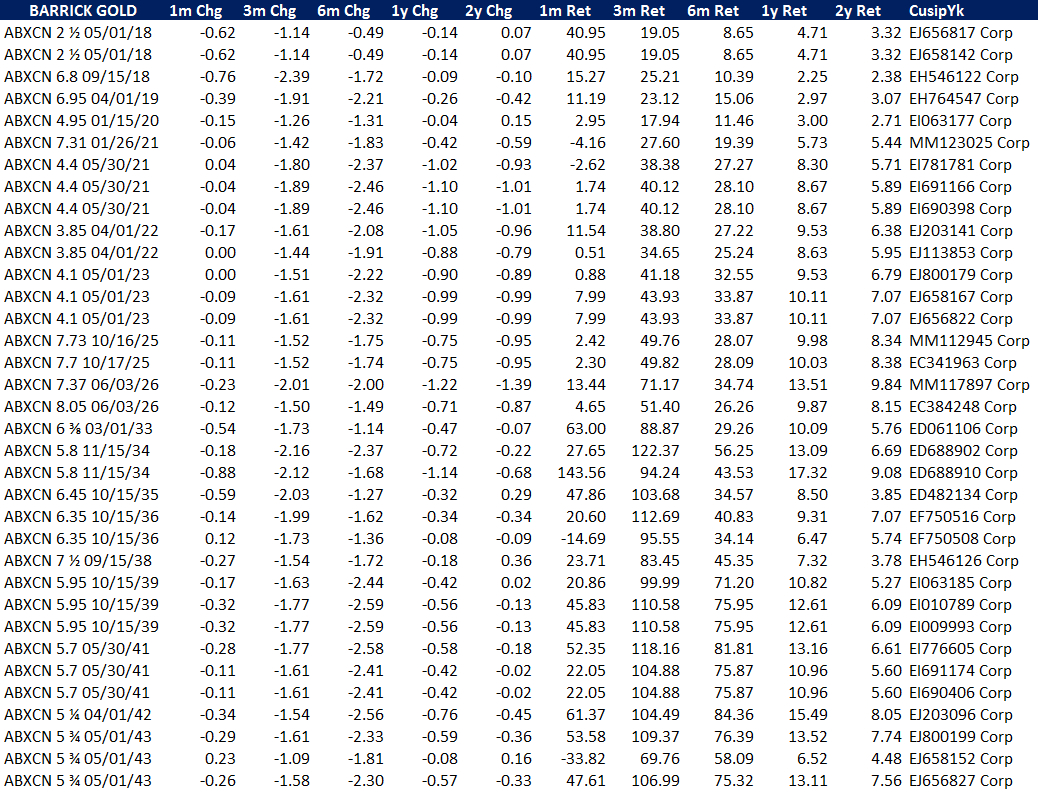
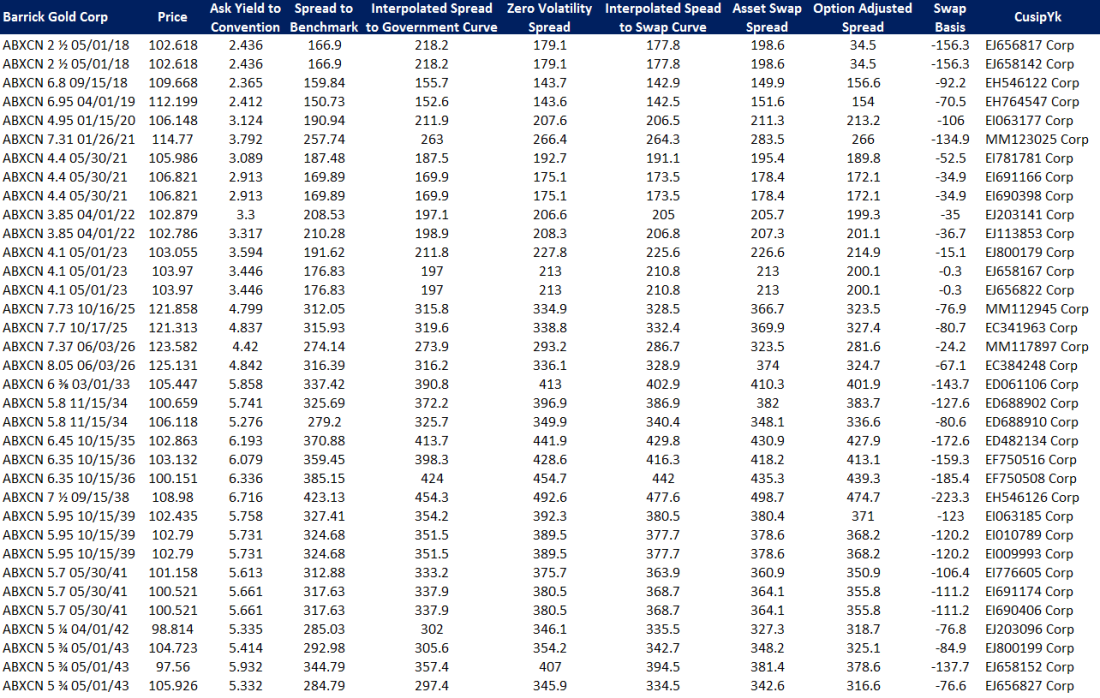
Barrick bonds yields have risen significantly in the last month as 1-6m yields have shown bearish returns:

Barrick Bonds.PNGBarrick Bonds 2.PNG

Barrick Gold Comparables

The following table is a brief overview of the eight largest gold miners with market capitalization >US$10 billion:

Equity Valuation

Gold comps - equity valuation.PNG

  • EV/EBITDA: a lower ratio would be most suitable – Newmont and Newcrest appearing to have the strongest ratios;
  • P/E: this is the clear sign that gold miners are overpriced;
  • P/B: another clear sign that gold miners are overpriced relative to their book value

Profitability

Gold comps - profitability.PNG

  • A notable exception among the top eight gold miners, despite LBMA prices returning to pre-2009 levels, is Franco-Nevada who do not operate mines but manage their royalties and streams only, hence recording one of the lowest revenues among its peers.
  • Top and bottom line margin growth is inconsistent among the eight miners, further questioning why share prices have grown so rapidly since January 1st.

Market Return

Gold comps - market return.PNG

  • Despite weak fundamentals, all eight gold miners have seen their share prices, bar Saudi Arabian Mining, risen between 43%-166% since January 1st (Barrick being the gold miner seeing a 166% return YTD).
  • However, on a 3-year and 5-year annualized basis, the three largest gold miners (Barrick, Newmont, Goldcorp) have seen a negative growth in their share price, while the three smallest comparable miners (Franco, Newcrest, Agnico Eagle) have seen strong growth in their share price.

Pricing Indicators

Gold comps - market performance.PNG

  • RSI: all relative strength index indicates that share prices are already in the overbought territory and nearing its breaking point of 70;
  • MA: Barrick, Newmont, and Agnico are those notables sitting above their 100D moving average.